
Appendix: What We Know about Threats and Political Violence in the U.S.

To make political violence backfire, it’s important to learn from available information about its use in the US—for example, how common is political violence in the US right now?; what do we know about who’s making threats?; and other questions. New information is being produced all the time, so what exists in this guide is current as of March 2024.
This section is written in a simple question-and-answer format. It will address the following questions:
How many people support political violence in the US, and how many oppose it?
What is the likelihood of acts of physical political violence in the US?
Which groups are most likely to incite, threaten, or enact physical political violence?
How much are threats and physical political violence increasing?
What evidence shows the impacts of threats and political violence on the US?
1. How is “political violence” defined?
In communities across the United States, people are concerned about many forms of violence. This includes physical and direct forms such as violent crime, domestic violence, terrorism, hate crimes, and police brutality; emotional forms such as psychological violence; and indirect forms such as structural violence.
Political violence (PV) can overlap with these categories. What defines it is that it is:
force or violence, including threats and intimidation, used with a political motivation, to achieve a political goal, to assert political power over another group, or to disseminate a political message to an outside audience.¹¹⁰
Political violence therefore has multiple forms and effects. It can take the form of direct threats and physical violence targeting individuals. It can also take the form of implied threats and intimidation against onlookers and broader audiences. It can take place in single high-visibility events, such as the January 6, 2021 attack on the US Capitol, but it can also happen in low visibility and pervasive ways (such as carrying weapons during political activity, and making threatening general statements online or in person) that aim to victimize both individuals and communities. In any of these forms, the effects of political violence can be highly damaging.

While this guide uses the above definition, there are other good definitions of political violence as well—including some that are more narrow and focus primarily on acts that inflict direct physical harm.¹¹¹ No single definition is perfect.
In addition, while the definition used in this guide is broad, sometimes it is helpful to focus on particular aspects of political violence rather than a single broad definition. For example, in this guide, we often distinguish between “threats of political violence” and “acts of physical political violence,” because although these aspects of PV are related, it can also be useful to analyze them separately.
2. How many people support political violence in the US, and how many oppose it?
Surveys have tracked Americans’ willingness to support political violence over recent years. Although there is some variation in results—which is likely due to the way polling questions are phrased, the timing when a poll is taken, and the composition of a poll’s respondents—they consistently find that overwhelmingly Democrats, Republicans, and Independents reject political violence. Surveys also find that a small minority believes that political violence is acceptable in some cases. And an even smaller minority seem willing to actually commit such acts.

For example, a January 2024 report by Democracy Fund found that over 80% of respondents agreed that “violence to advance political goals is never justified,” it is '“never okay to send threatening messages to leaders of the other party,” and it is “never okay to harass members of the other party online.”¹¹² Results are broken down below according to party identification.

¹¹³
In contrast to this widespread opposition, the report also looked at the percentage of survey respondents who have consistently expressed support for political violence across four previous surveys going back to November 2019, and found that:
Only approximately 2.5% of respondents consistently felt the use of political violence was justified, and/or that it was okay to harass members of another political party.
Only approximately 1.3% or respondents consistently felt that it was ok to send intimidating messages to leaders of the other party.¹¹⁴
From this data, one can conclude that the number of Americans who reject political violence is more than 30 times greater than the number of Americans who consistently support it.
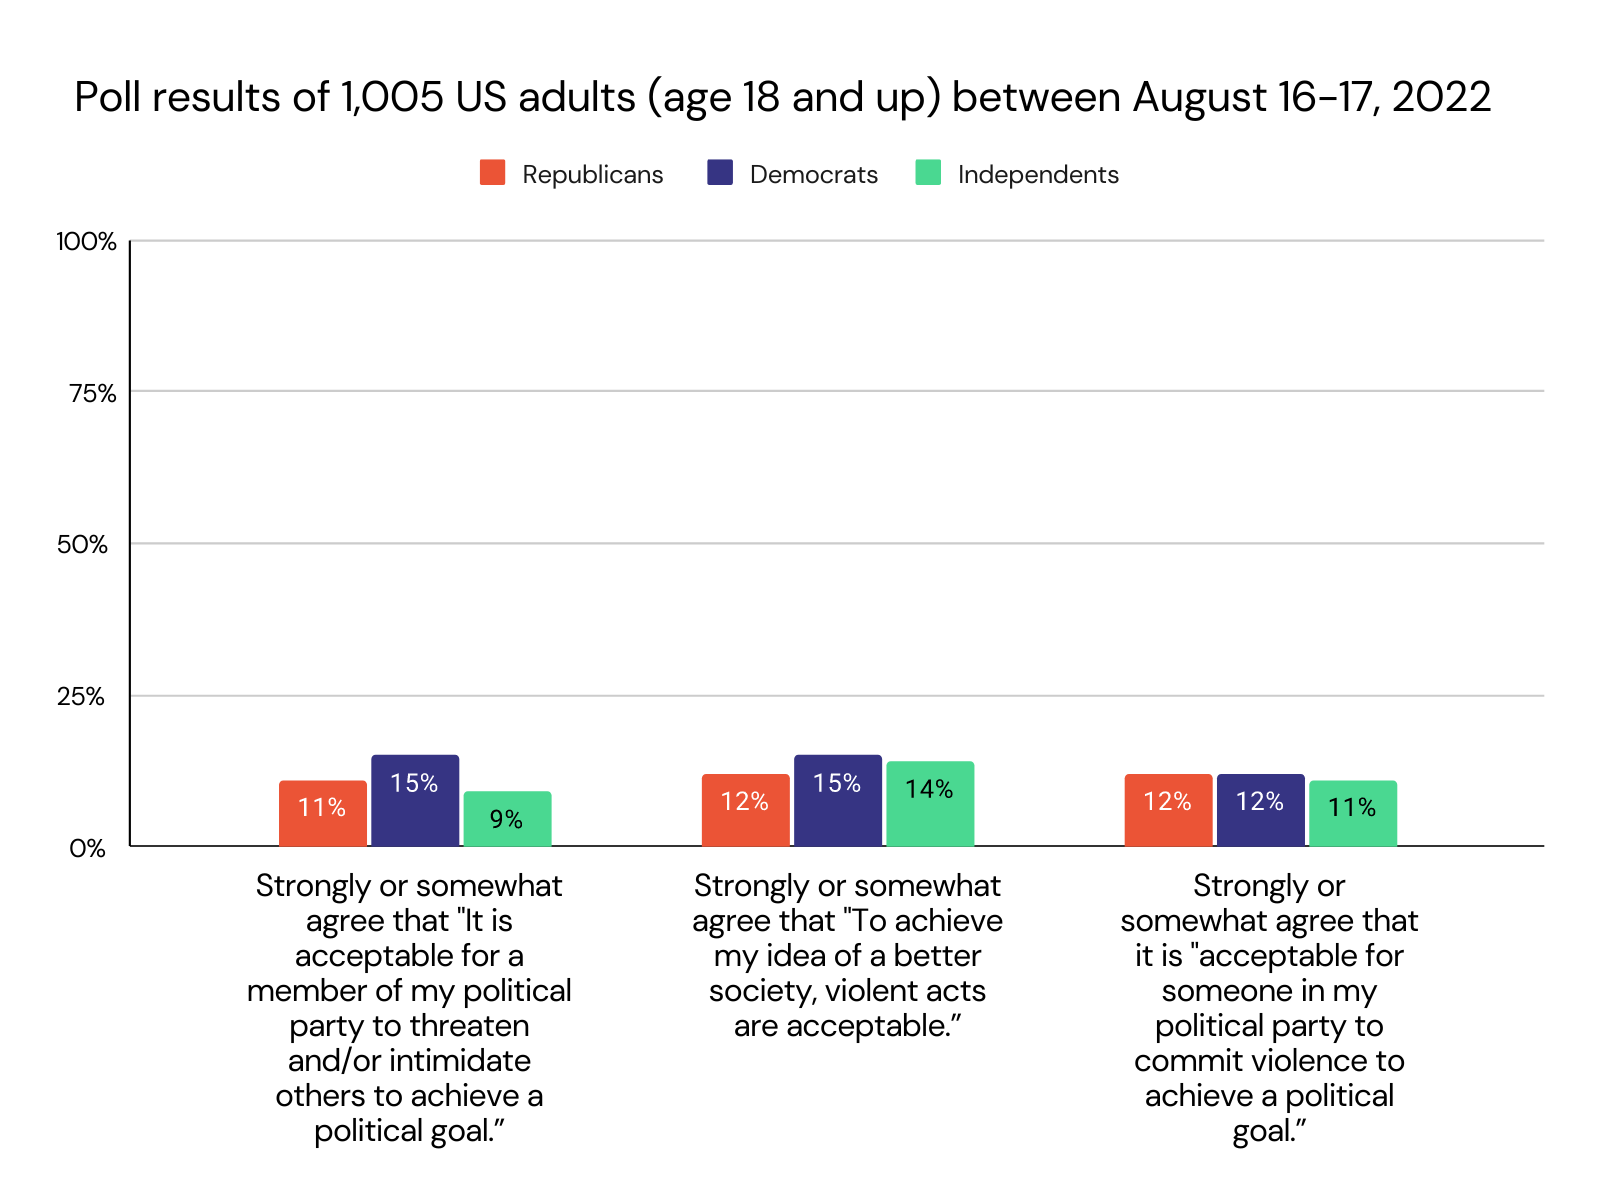
Other polls find greater potential support for political violence among the American public, but they still come to similar conclusions: that the vast majority oppose political violence and a small minority support it. For example, an August 2022 poll by Reuters/IPSOS found the following results:¹¹⁵

¹¹⁶
In addition, the Reuters/IPSOS poll found that 66% of respondents (60% of Republicans, 73% of Democrats, and 63% of Independents) expressed that they were concerned about acts of violence committed against people in their community because of their political beliefs.¹¹⁷
A related question is whether support for political violence is rising or falling. On this, different polls come to different conclusions, likely based on the way they phrase the question. For example, a survey by PRRI/Brookings released in October 2023 asked a general question about political violence and found that:
support for political violence has increased over the last two years. Today, nearly a quarter of Americans (23%) agree that “because things have gotten so far off track, true American patriots may have to resort to violence in order to save our country,” up from 15% in 2021.¹¹⁸
However, another poll covering approximately the same two-year time period suggests a contradictory conclusion. Asking about the use violence to achieve a specific goal, the University of Chicago’s Project on Security & Threats (CPOST) found that the percentage of people agreeing that “The use of force is justified to restore Donald Trump to the Presidency” declined from approximately 9% in June 2021 to about 4.5% in April 2023, and then moving to 7% in June 2023.¹¹⁹
Several conclusions emerge from these numbers:
The vast majority of Americans from both major political parties, as well as Independents, oppose political violence.
A significant majority of Americans are concerned about political violence.
A small minority of Americans believe that political violence may be necessary now or at some point in the future.
Based on existing survey data, it is unclear whether the small minority of Americans that may support political violence has grown or declined since 2021—this is probably the result of different surveys asking different questions about this.
Only a very small percentage of Americans (approximately 2.5%) seem consistently committed to political violence as a way of making change.
Among the very small percentage of Americans who seem consistently committed to political violence as a way of making change, only a very small fraction of them seem willing to act on that view (as we will see in question 3 below).
3. What is the likelihood of acts of physical political violence in the US?
Determining the likelihood of political violence depends in part on how one defines the phenomenon. While at least six different entities in the United States (ranging from universities to research groups) track political violence, there is no single standard definition for the term.¹²⁰
In addition, even when researchers adopt a shared definition focusing only on physical political violence, challenges still remain with tracking such incidents. This is because political violence involves determining both an act and intent (does the attacker aim to advance political goals?). All violence has political implications, but answering the question of clear political intent can be difficult at times. For example, under what circumstances should violent hate crimes or acts of domestic terrorism in the US be defined as acts of physical political violence? Or when police use violence against civilians or protesters (who can have a range of goals, and conduct themselves in many different ways), under what circumstances should that be considered political violence?
In spite of these definitional and tracking challenges, there is a general view that the actual incidence of physical harm from political violence in the US is still quite low for a country with a population of over 330 million people.
Here are findings of two analyses that use different narrow definitions of PV and assess different data on this topic:
An August 9, 2023 special report by the media organization Reuters identified 213 cases of political violence nationwide since January 6, 2021.¹²¹ These acts resulted in a total of 39 deaths, which can be attributed to eight assailants. The kinds of political violence that resulted in death varied, with the special report stating:
Some deaths followed one-on-one disputes, such as a fatal brawl last year between two Florida men arguing over Trump’s business acumen. Others happened in public settings, such as the shooting of five social justice protesters in Portland last year by a man immersed in far-right political rhetoric. Politically motivated mass killings claimed 24 of the lives, including the May 2022 shooting of 10 Black shoppers in Buffalo by a white supremacist who called for a race war.¹²²
An analysis of data from the Armed Conflict Location and Event Data project (which is a leading source of information on violence worldwide) found a higher number of incidents and fatalities than the Reuters analysis, but the total was still relatively low considering the size of the US. The authors state that:
245 instances of political violence took place in the United States in 2022, the most recent year that included national elections. Most of these events were relatively small in scale, such as minor protests that turned violent. Any level of political violence in the United States is too high, but for the average American, the personal risk of experiencing physical harm from political violence specifically remains fairly low.¹²³
From these 245 instances of political violence in 2022, there were 97 fatalities. They were followed in 2023 by 214 incidents resulting in 64 fatalities.¹²⁴
If these numbers on political violence seem too low to you, it is important to remember that incidents of physical political violence—especially incidents where injuries were minor—are likely underreported. You may also have different criteria to define physical political violence than the ones that were used in these analyses. For example, Reuters notes that “Incidents initiated by police or other government agents in their official capacity were excluded” from their data. However, taken together, the Reuters and ACLED data suggest that with a fairly narrow definition of PV, focused on physical violence that is directly attributable to a clear and specific political motive, the incidence of physical political violence remains relatively low in the US. This is so even though the FBI’s reported incidence of hate crimes (the majority of which do not involve physical violence) in the US rose from 10,840 incidents in 2021 to 11,634 incidents in 2022, and even though the overall rate of homicide remains high in the US, relative to other comparable democratic countries.¹²⁵
Thus, while fear of PV has risen in recent years, and US society struggles with numerous forms of violence in general, actual physical political violence (narrowly defined) has remained relatively rare. For this reason, some argue that threats of political violence are doing greater damage to the US and to people’s lives than physical political violence itself. For example, former FBI director James Comey argues that “we have a much bigger problem with threats of violence than we do with actual violence.”¹²⁶
4. Which groups are most likely to incite, threaten, or enact physical political violence?
The current US climate for political violence can be analyzed based on three kinds of actors:
Those who seek to incite threats (inciters)
Those who make threats or engage in other acts of intimidation (threat-makers)
Those who enact direct physical political violence (enactors)
People in these groups can overlap (for example, inciters are sometimes also threat-makers, and threat-makers are sometimes also enactors). However, it can be helpful to analyze each group distinctly to understand how the ecosystem of political violence works, the roles that various groups play, and their attributes.
Inciters
Inciters target and dehumanize individuals and groups with toxic rhetoric, which sets conditions for PV. Inciters can be thought of as political entrepreneurs—they have an interest in building a following so they can profit politically and economically by creating toxic polarization, feeding outrage, and trafficking in disinformation (which contains direct falsehoods) and/or malinformation (which contains some facts with highly misleading context). Notably, inciters often have no interest in personally risking their own lives or livelihoods to enact threats. Rather, they see a market that they feed content to, they profit from it, and threats and political violence are a result.

We tend to know who inciters are—they generally want to be known and use various media platforms because building their influence is part of their goal.
However, some inciters try to remain anonymous while building a following. In some cases, this can be because they are foreign-backed.¹²⁷ The Department of Homeland Security notes that foreign actors have:
sought to contribute to U.S. internal discord and weaken its focus and position internationally. These actors have amplified narratives that radicalized individuals have cited to justify violence, including conspiracy theories and false or misleading narratives promoting U.S. societal division…. Some of these actors have used these conspiracy theories to justify calls for violence against U.S. officials and institutions.¹²⁸
Threat-makers
We don’t have complete data on who threat-makers are. Many of them engage anonymously and many threats are likely unreported to government authorities or other institutions that try to track political violence.
However, there is some data from which we can draw. First, we can look at support for political violence across various demographic groups to figure out which groups have the greatest number of potential threat-makers (although notably, a higher number of potential threat-makers is not the only important factor here—the intensity of their views about political violence also matters). Second, we can analyze the limited data that exists about who actually makes threats.
Based on this information, here are some general conclusions:
Support for political violence exists among groups on various parts of the US political spectrum.
Support for political violence tends to be higher among people on the political right than the political left, although there is some variation in this finding.
The vast majority of threat-makers are men.
Threat-makers tend to be older, more educated, and more financially secure than the general population of violent criminals.
Some threat-makers pretend to be domestically based, but actually originate as part of foreign government activity.
The first two conclusions about political ideology and support for PV above are based on polling and surveys. For example, a PRRI/Brookings survey released in October 2023 found that 33% of Republicans, 13% of Democrats, and 22% of Independents agreed with the statement that “because things have gotten so far off track, true American patriots may have to resort to violence in order to save our country.”¹²⁹
In addition, the survey found even higher levels of potential support for political violence among people who held the following views (which correlate with the political right):¹³⁰
Americans who believe that the 2020 election was stolen from Donald Trump (46%);
Americans who hold a favorable view of Trump (41%);
Americans who believe in the so-called “replacement theory,” that “immigrants are invading our country and replacing our cultural and ethnic background” (41%); and
Americans who affirm the core tenet of white Christian nationalism, that God intended America to be a new promised land for European Christians (39%).

¹³¹
However, findings on this topic are not always consistent. For example, an August 2022 poll by Reuters/IPSOS found overall lower support for political violence among all groups, and also found somewhat greater support for political violence among Democratic respondents than Republican respondents, including that:¹³²
11% of Republicans, 15% of Democrats, and 9% of Independents expressed at least some agreement that “It is acceptable for a member of my political party to threaten and/or intimidate others to achieve a political goal.”
12% of Republicans, 15% of Democrats, and 14% of Independents expressed at least some agreement that “To achieve my idea of a better society, violent acts are acceptable.”
12% of Republicans, 12% of Democrats, and 11% of Independents expressed at least some agreement that it is “acceptable for someone in my political party to commit violence to achieve a political goal.”¹³³
¹³⁴
In addition, threat-making is not just a result of believing that political violence may be necessary. It also relates to the intensity of that belief. On this point, there is reason to suspect the actual number of people who strongly support the use of political violence is smaller than the above polls indicate. For example, a January 2024 report by Democracy Fund looked at the percentage of survey respondents who consistently supported violence across all four of their surveys going back to November 2019 (consistent support likely corresponds to intensity of belief).¹³⁵ They found that over the approximately four-year period:
Only 4% of Republicans, 2% of Democrats, and 0% of Independents consistently felt the use of political violence was justified, and/or that it was okay to harass members of another political party.
Only 2% of Republicans, 1% of Democrats, and 0% of Independents consistently felt that it was ok to send intimidating messages to leaders of the other party.¹³⁶
Beyond looking at public polling, we can also draw lessons from data about actual threats. CNN analyzed 540 cases of individuals who were federally charged for threats against public officials or institutions between January 2013 and November 2023.¹³⁷ They found that the vast majority (nearly 95%) were male, with a median age of 37. They also cite University of Maryland criminology professor Gary LaFree suggesting that threat-makers tend to be older, better educated, and more financially secure than perpetrators of other violent crimes.
CNN further commented that mental health issues, divorce, solitude, grief, and substance abuse were “recurring theme[s] in the lives of many offenders.”¹³⁸ However, it should be noted that the vast majority of individuals who experience these life circumstances do not go onto threaten political violence, and that primarily attributing threats to these circumstances overlooks the powerful role that inciters play in fomenting PV.
Lastly, some anonymous threats may not originate from people in the US at all, and in fact may be directed by foreign governments. For example, in 2021 the US Department of Justice charged two Iranian nationals with an array of offenses related to the 2020 election, including “an online voter intimidation campaign involving the dissemination of a threatening message… purporting to be from the Proud Boys, to tens of thousands of registered voters…. The emails were sent to registered Democrats and threatened the recipients with physical injury if they did not change their party affiliation and vote for President Trump.”¹³⁹
Enactors
While a small minority of Americans potentially support threats and PV, a far smaller percentage actually enact physical political violence.
What do we know about these people? Based on existing research and expert analysis, we can conclude that the vast majority of deadly political violence attacks are carried out by right-wing individuals, and that the threat of physical political violence appears to come mostly from lone offenders and small groups. In addition, evidence suggests that threat-makers and enactors are often distinct from each other—that those who threaten political violence often do not perpetrate physical political violence, and those who enact physical political violence sometimes do not make direct threats beforehand.
The prevalence of deadly right-wing political violence is substantiated by multiple sources. For example, as mentioned earlier, an August 9, 2023 special report by the media organization Reuters identified 213 cases of political violence since January 6, 2021.¹⁴⁰ Reuters found that “Of the 14 fatal political attacks since the [January 6, 2021] Capitol riot in which the perpetrator or suspect had a clear partisan leaning, 13 were right-wing assailants. One was on the left.”¹⁴¹
In addition, an analysis by the Anti-Defamation League (ADL) that focused on “extremist mass killings” found that:
All the extremist-related murders in 2022 were committed by right-wing extremists of various kinds, who typically commit most such killings each year…. Left-wing extremists engage in violence ranging from assaults to fire-bombings and arsons, but since the late 1980s have not often targeted people with deadly violence.¹⁴²
The ADL report also found that right-wing extremists were responsible for 75% of all extremist-related murders between 2013 and 2022. Meanwhile, 20% were attributed to Islamic extremists, while only 4% were attributed to left-wing extremists, and 1% to miscellaneous extremist groups.

¹⁴³
Notably, this finding directly contradicts the views of many Americans. In a May 2022 poll conducted by Yahoo/YouGov, most respondents believed that the threat of deadly political violence in the US originated more equally from the political right and the political left. Only 18% answered correctly that almost all “U.S. murders linked to political extremism over the last decade” were committed by right-wing extremists.¹⁴⁴
The people most likely to carry out these attacks are also assessed to be individuals radicalized in the US and often acting alone or in small groups. As stated in the US Department of Homeland Security’s Threat Assessment for 2024:
During the next year, we assess that the threat of violence from individuals radicalized in the United States will remain high, but largely unchanged, marked by lone offenders or small group attacks that occur with little warning.¹⁴⁵
Among these radicalized individuals, how often do threat-makers also become enactors of physical political violence? We can’t be certain, but the answer may be that this happens with less frequency than is commonly assumed. For example, in their analysis of 540 cases of prosecuted threats against public officials, CNN found that “at least 44 cases in which people who made threats took additional steps to follow through.”¹⁴⁶ This represents only approximately 8% of cases, which means that in many cases CNN did not find that threat-makers took clear steps to enact physical political violence.
However, what about those who enact political violence—do they tend to make threats beforehand? Surprisingly, it appears that sometimes they do not. As Katherine Keneally of the Institute for Strategic Dialogue comments, sometimes serious attackers do not issue threats “because they are very much focused on wanting to stay under the radar.”¹⁴⁷ For example, according to the Secret Service and other authorities, the right-wing assailant who seriously injured the husband of Speaker of the House Nancy Pelosi in 2023 issued no threats in advance. Similarly, the left-wing assailant who shot Congressman Steve Scalise and others in 2017 also issued no threats in advance.¹⁴⁸
5. Which groups are most likely to receive threats?
Threats are directed to many groups in US society. People at the local, state, and national level of any gender, race, ethnicity, or political leaning can be threatened with PV. Amidst this widespread attack on democracy, it is notable that on average some groups seem to receive more threats than others. Knowing who is most likely to be threatened is important in understanding the impact that PV has (which we discuss further in question 8 in this section) and anticipating which individuals or groups may be most likely to need support.
Some insights and research findings are that:
Local election workers are highly targeted.
Members of state legislatures are highly targeted.
Local elected officials are highly targeted.
Elected officials from both political parties receive a significant amount of threats.
Women are significantly more likely than men to be targeted.
People of color are more likely to receive threats.
When individuals are in the news, they are more likely to receive threats.
The deliberate targeting of election officials with threats is not surprising. People with ideas that are not able to win popular support in elections may seek instead to sabotage elections themselves. An analysis of 400 cases of locally targeted threats across 43 states occurring between January 2020 and September 2022 found that targeted groups included:
election officials or poll workers (35 percent), followed by school officials (31 percent), other locally elected or appointed officials (21 percent), and health officials (12 percent).¹⁴⁹
Individuals in all of the above groups need support. However, part of what sets election workers apart is the consistency with which they have been targeted, and their immediate and essential role in maintaining democracy. Recent analysis from a March-April 2023 survey reveals that “30% [of local election officials] say they have personally been abused, harassed, or threatened because of their job” and “nearly half are concerned about the safety of their colleagues and/or staff.”¹⁵⁰ Evidence also points to the increased likelihood of threats or harassment in swing states with high levels of election fraud claims.¹⁵¹
In addition to election officials, state legislators also seem to receive a particularly high number of threats. A broad national survey of more than 1,700 officials from all 50 states, which was completed in October 2023, found that:
43% of state legislators experienced threats over the past three years.
18% of local elected officeholders experienced threats over the past three years.¹⁵²
Similarly, local elected officials (i.e., mayors, city councilmembers, and county officials) are all likely to be targeted. A national survey of local elected officials from December 2023-January 2024 revealed that:
34% of local officials reported that they were “harassed verbally, in writing, or online” over the previous three months.
17% that they were “threatened verbally, in writing, or online” over the previous three months.
1% were “attacked physically” over the previous three months.¹⁵³
Data also suggests that comparable numbers of both Democrat and Republican officials are targeted by threats. For example, in the previously cited national survey of local elected officials, 18% of Democrats, 19% of Independents, and 20% of Republicans reported threats over the previous three months.¹⁵⁴

Analysis of federally prosecuted threats during the Trump and Biden administrations also found a balance of threats between parties, concluding that “Republicans and Democrats were targeted almost evenly: 82 threats leveled at named Republican officials and 80 threats against named Democrats….”¹⁵⁵
Threats to members of Congress further show equal targeting of both parties. For example, the US Capitol Police investigated 7,501 cases of threats in 2022 and commented that “All Members of Congress receive threats and concerning statements” and “The number of threats against both parties are similar.”¹⁵⁶
We should not conclude from this, however, that an equal number of threats against Democrats and Republicans means that there is also an equal number of threat-makers from both parties. A common aspect of political violence is to try to scare members of one’s own party to accept or support more extreme political positions and to punish party members who seek moderation. This means that some threat-makers may threaten members of their own party as well as members of the opposing party.
Beyond examining an individual’s role and party, we also know that in general women, and people of color are more likely to receive threats. One study assesses that women are on average 3.4 times more likely to receive threats and harassment than men.¹⁵⁷ Another from December 2023-January 2024 found that 23% of women local elected officials received threats over the past three months, versus 18% of male local elected officials.¹⁵⁸
This same study also found that “racial and ethnic minorities experience all hostile event types [insults, harassment, threats, and attacks] to a greater degree than non-minorities,” with 25% of minority elected officials receiving threats in the last three months, versus 18% of non-minority elected officials.¹⁵⁹ Other studies reinforce this finding, showing that people of color, and particularly women of color, tend to be subject to a higher incidence of a range of abusive conduct (including, but not limited to, threats) in their roles as mayors, local elected officials, and as political candidates.¹⁶⁰
In addition to the heightened incidence of threats of PV against women and people of color, rising hate crimes against LGBTQ communities, particularly around drag shows, likely also means a higher incidence of threats of PV for these communities as well.¹⁶¹
Lastly, heightened media exposure of individuals results in a higher incidence of threats. This may be one of the most reliable short-term predictors of who will be targeted. US Capitol Police Chief Thomas Manger commented, “Any time a member of Congress is in the news, whether it’s good or bad or just neutral … you will see a spike in threats to that individual member. It just gets people to notice.”¹⁶² And inciters draw attention to individuals or events in ways that increase threats. For example, CNN found “a pronounced spike in threat cases in the leadup to and the immediate aftermath of the January 6 attack, underscoring the mass hysteria that made the period so dangerous and destabilizing.”¹⁶³
6. How much are threats and acts of physical political violence increasing?
There are several challenges in answering this question. The first is that various definitions of threats and political violence will yield different results. In addition, any official tally of threats is probably an undercount, because many threats likely go unreported.¹⁶⁴ For example, a 2024 survey of local election officials found that 45% who had been threatened did not report the threat to law enforcement.¹⁶⁵ It can also be difficult to discern exact lines for when harassment becomes intimidation and when intimidation becomes a direct threat. More generally, tracking any political violence can be challenging because of potential underreporting, and particularly because it is not always clear whether an attacker’s motivation qualifies as political intent.
Nonetheless, data shows that both threats and physical political violence have risen significantly since 2016.¹⁶⁶ There is also evidence that they have stabilized in recent years (although they remain at a much higher level than a decade ago) and may have even declined somewhat in the last two years.
Here is some supporting evidence:
The US Capitol Police (USCP) have released their numbers of investigated threat cases from 2017-2023, showing rapid growth of threats during this time, followed by an overall decline after 2021:¹⁶⁷

¹⁶⁸
Notably, even with the recent decline over the last two years, the number of investigated threats in 2023 was still more than double the number of threats investigated in 2017.
The US Marshals Service, which provides protection to federal judges, jurors, and other courtroom personnel, similarly reported a large uptick in threats and “inappropriate communications” against the judiciary starting in 2016 and then declining in 2022 and 2023.¹⁶⁹ These are reported as follows:

¹⁷⁰
A CNN investigation of federally prosecuted threats against public officials or institutions also came to a similar conclusion. It found that “Politically motivated threats to public officials increased 178% during Trump’s presidency,” and also that such threats decreased in 2022.¹⁷¹ It further found that during this time “threats to both parties rose sharply,” with an increase of threats to Republicans even greater than the increase for Democrats.¹⁷² It appears that threats affected “all levels of public officials, from members of Congress to state election officials to governors to city council candidates.” In addition, the investigation found that “threats related to hot political topics like abortion or police brutality also skyrocketed during the Trump years, increasing by more than 300% from Obama’s second term.”
This rise in threats has certainly been noticed by public officials. A 2024 survey of local election officials found that 70% feel that threats have increased since 2020.¹⁷³ Similarly, a 2023 survey of intimidation of state and local officeholders found that:
38% of state legislators “reported that the amount of abuse they experience has increased since first taking public office,” while only 16% reported that it has decreased.
29% of state legislators “reported that the seriousness of the incidents has increased,” while only 12% reported that it has decreased.¹⁷⁴
Beyond the rising incidents of threats, the risk of physical political violence also seems to be increasing. According to University of Maryland criminologist Gary LaFree, who has tracked violence and terrorism in a database between 1970 and 2020, incidents of political violence began rising in 2016.¹⁷⁵
This coincides with an overall rise in incidents of domestic terrorism (such as mass shootings, although not all of these incidents are necessarily political violence), which have grown by 357% over the last decade, according to the US Government Accountability Office.¹⁷⁶ Similarly, according to FBI reports, hate crimes in the US have risen since at least 2014.¹⁷⁷
Nonetheless, as noted previously, physical political violence (narrowly defined) remains relatively rare.
7. Why is political violence increasing?
There are a range of intersecting factors that contribute to the rise in political violence in the US. These include the actions and rhetoric of powerholders, technologies such as social media that propagate disinformation, certain underlying attitudes and political views in the US population, and the incentives of individuals and groups.
Of these four factors, the first three have received a significant amount of public attention, and they are briefly outlined below. However, the fourth factor—the incentives of individuals and groups—has received relatively less attention, even though it is one of the most important. Furthermore, the fourth factor is also the easiest for communities to directly influence, and by doing so, they can make political violence backfire.
Powerholders, Technologies, Public Sentiment, and Incentives
Media attention to PV tends to focus on the actions of powerholders (i.e., politicians and certain commentators) and the use of online spaces (i.e., social media) to promote disinformation and polarization. These drivers were especially powerful during the COVID-19 pandemic.
Some powerholders have also inflamed and increased the threat of PV related to certain issues (sometimes these are referred to as potential “trigger” issues), including matters related to abortion, the electoral process, immigration policy, public school curricula, and LGBTQ rights.¹⁷⁸
This toxic rhetoric, combined with online disinformation, builds on certain underlying sentiments in the population, which can make people more receptive to the idea of political violence.¹⁷⁹ These sentiments include a loss of faith in US democracy (due to economic inequality, political gridlock, corruption, or the seeming inability of government to address certain chronic problems); racism, sexism, and other forms of prejudice; fear of demographic and cultural changes in the United States; and an “arms race” mentality by which people justify their own support for PV based on the belief that their political opponents support PV.¹⁸⁰
The Department of Homeland Security speaks to the interplay of these factors in their June 2022 Summary of Terrorism Threat to the United States,
The continued proliferation of false or misleading narratives regarding current events could reinforce existing personal grievances or ideologies, and in combination with other factors, could inspire individuals to mobilize to violence.¹⁸¹
However, these general factors driving political violence are not the full story. They all contribute to a fourth factor, which is the incentives of individuals and groups. These incentives particularly help to explain the deeply damaging rise in threats in the US. In short, threats are increasing because they provide benefits to those who incite and make them.
For those who want power but know they cannot enact their agenda through a free and fair democratic process, threats are a powerful and cheap way to attack democracy and advance an authoritarian alternative. Inciting threats is also often politically and economically profitable in a personal sense for individuals, who may build an online following. Threats can further provide a psychological benefit (feeling powerful, feeling part of a group) to those who make them.

This cost-benefit analysis helps to explain why there is a sharp rise in threats, while at the same time relatively few people actually carry out physical political violence. Physical political violence entails personal risk, and often also requires resources, planning, and time spent identifying an opportunity. Threats are much cheaper and can accomplish a similar result (e.g., influencing decision making, and scaring people into silence and withdrawal from political life) with minimal risk, resources and planning. A computer or mobile phone provides the means (email, text message, etc.), motive (toxic media), and opportunity (anytime, since the internet is always available) to make threats.
This powerful impact of personal and group incentives is a challenge to address, but it is also an opportunity, because it means that shifting these incentives can have a significant effect on curtailing threats. If incitement and making threats becomes more costly and provides fewer benefits, the marketplace for these behaviors will diminish, along with the associated acts of physical political violence that they inspire.
The federal, state, and local governments are aware of these incentives, yet are limited in their ability to change them. Typical government approaches to stopping unwanted behaviors—such as passing laws that impose civil fines or criminal prosecution—have not worked well against incitement and threats. This means that those who engage in these behaviors tend to reap benefits while going unpunished. Many threats are made anonymously or never reported to authorities, but critically, many threats are also protected as free speech, so the risk of legal consequences for perpetrators is minimal. For example, of the 7,501 threats investigated by the US Capitol Police in 2022, only 46 (0.6%) led to prosecutions.¹⁸² In addition, the US Department of Justice noted in 2022 that its Election Threats Task Force reviewed over 1,000 contacts that were “reported as hostile or harassing” by election workers and concluded that only “approximately 11 percent of those contacts met the threshold for a federal criminal investigation.”¹⁸³ Of those 11 percent, even fewer may result in federal charges.

Fortunately, as the number of threats has risen in recent years, prosecutions have risen as well, and according to one study, nearly 80% of prosecutions resulted in convictions.¹⁸⁴ However, the incredibly small number of prosecutions overall reflects the conclusion of US Capitol Police consulting psychologist Mario Scalora, who stated, “This is not a problem we can only arrest our way out of.”¹⁸⁵
“This is not a problem we can only arrest our way out of.”
Moreover, difficulties with prosecutions cannot be fully addressed by adding more criminal statutes. New laws can help (and we provide some examples of these in question 9), but legal approaches in general face a major constitutional challenge in determining the boundary between protected First Amendment speech and illegal activity.¹⁸⁶ Illustrating this challenge, Seamus Hughes, a senior researcher at the National Counterterrorism Innovation, Technology and Education Center (NCITE) at the University of Nebraska offers an example of the distinction between the threats: “‘I’m going to kill you at 12:01’ versus ‘I’m going to kill you.’” He comments that “If you got a good lawyer, you’re off on the second one.”¹⁸⁷
8. What are some documented impacts of political violence in the US?
Threats and physical political violence can happen relatively quickly, but the extent of damage that they do is rarely immediately apparent. Rather, it unfolds over time, and often in subtle ways. This is because much of their impact comes from increases in fear and shifts in behavior among portions of the population.
Some of their major effects are also difficult to quantify. For example, who can determine how many talented and committed people over the last decade in communities across the country have privately chosen to abstain from speaking freely, exercising their rights, or participating in public life out of fear of threats and political violence? In addition, how has this enabled the very small minority of Americans who threaten political violence to shape public debate, influence who chooses to run (or not to run) for public office, and sway the decisions of public officials, businesses, journalists, and others?¹⁸⁸ There are strong indications that these dynamics have happened, and the extent of their impact is likely very significant, but difficult to calculate.
However, available evidence points to a variety of impacts, including that threats and fear of political violence:
Have caused politicians to change votes on significant legislative matters.
Impose significant psychological distress, physiological harm, and resource costs on elected officials and civil servants. These may also negatively impact job performance.
Drive qualified politicians and civil servants out of public service.
Are likely to result in a more white and male election candidate pool.
Create barriers to public officials connecting with their constituents.
The sum total of these effects—and many others that we can’t directly quantify—is that the threat of PV empowers a small subsection of the population to seize power against the majority through anti-democratic means.
Accordingly, perhaps one of the strongest pieces of evidence of the impact of PV is the fact that threats have risen significantly over the last decade—if they were not advancing the goals of those who make and incite them, they would have declined instead.
Evidence for some of their specific impacts is detailed below:
Causing Politicians to Change Votes
Compelling accounts of the power of threats and fear of political violence emerged from Congress shortly after the January 6, 2021 insurrection at the US Capitol. During the ensuing impeachment and Senate trial of President Trump, a number of Republicans are reported to have changed their voting behavior out of fear. For example, Senator Mitt Romney’s biographer McKay Coppins wrote:
One Republican congressman confided to Romney that he wanted to vote for Trump’s second impeachment, but chose not to out of fear for his family’s safety. The congressman reasoned that Trump would be impeached by House Democrats with or without him — why put his wife and children at risk if it wouldn’t change the outcome?
Later, during the Senate trial, Romney heard the same calculation while talking with a small group of Republican colleagues. When one senator, a member of leadership, said he was leaning toward voting to convict, the others urged him to reconsider. You can’t do that, Romney recalled someone saying. Think of your personal safety, said another. Think of your children. The senator eventually decided they were right.¹⁸⁹
Fear afflicted the House of Representatives as well. Journalist Tim Alberta wrote a profile of freshman Republican Congressman Peter Meijer, stating that:
On the House floor [on Jan. 6], moments before the vote, Meijer approached a member who appeared on the verge of a breakdown. He asked his new colleague if he was okay. The member responded that he was not; that no matter his belief in the legitimacy of the election, he could no longer vote to certify the results, because he feared for his family’s safety. “Remember, this wasn’t a hypothetical. You were casting that vote after seeing with your own two eyes what some of these people are capable of,” Meijer says. “If they’re willing to come after you inside the U.S. Capitol, what will they do when you’re at home with your kids?”
...
At one point, Meijer described to me the psychological forces at work in his party, the reasons so many Republicans have refused to confront the tragedy of January 6 and the nature of the ongoing threat. Some people are motivated by raw power, he said. Others have acted out of partisan spite, or ignorance, or warped perceptions of truth and lies. But the chief explanation, he said, is fear. People are afraid for their safety. They are afraid for their careers. Above all, they are afraid of fighting a losing battle in an empty foxhole.¹⁹⁰
These are just several examples. Additional statements about the impact of fear on legislators were made by Rep. Liz Cheney, Rep. Jason Crow, and Pennsylvania State Senate majority leader Kim Ward, as well as several anonymous GOP lawmakers.¹⁹¹
“The majority of them are paralyzed with fear,” Crow said on “Meet the Press.” “I had a lot of conversations with my Republican colleagues last night, and a couple of them broke down in tears — saying that they are afraid for their lives if they vote for this impeachment.”
Surveys of local officeholders also find a similar dynamic. While not directly showing changed votes due to threats and fear of PV, a study released in January 2024 compiled responses from more than 1,700 local officeholders across all 50 US states and found that:
Approximately 20 percent of state officeholders and 40 percent of local officeholders acknowledged they were less willing to work on controversial topics due to abuse.
Fifty-three percent of state legislators believed that abuse had deterred their colleagues from taking on controversial topics.¹⁹²
Psychological Harm, Resource Costs, and Effects on Job Performance
Threats and fear of political violence inflict psychological and physiological harm on people. Damage can include emotional states such as sadness, anxiety, and recurring or intrusive thoughts as well as physical symptoms such as insomnia and headaches.¹⁹³
For example, a 2021 survey of nearly 1,000 mayors from cities across the US examined the impacts on those who experienced threats, property destruction, physical violence, and/or acts of psychological violence (i.e., online racial, gender-based, or sexual degradation). It found that:
13.1% of mayors reported their experience as “very upsetting.”
42.4% reported that their experience was “somewhat upsetting.”
21.2% reported “intrusive memories, nightmares, or similar effects.”
41.3% reported “increased levels of irritability, sleep disturbance, problems concentrating, or exaggerated startle responses.”
13% reported that their experience “diverted their attention from work and family quite a lot,” and 36.9% reported that it “did so at least a little.”¹⁹⁴
This aligns with the observation of professor Liliana Mason, who studies political violence, commenting that threats have “an acute effect of stopping people from doing their jobs.”¹⁹⁵
Fear of PV can also cause individuals to feel isolated. In interviews with more than 30 diverse elected officials, the Bridging Divides Initiative found that they “overwhelmingly reported feelings of isolation and loneliness.” They also found that “Almost all respondents indicated at least some level of behavioral change following threats and/or harassment” including “relatively small measures, such as deleting social media accounts, as well as more drastic steps, such as no longer inviting people over for social gatherings or acquiring a concealed-carry firearms permit.”¹⁹⁶
In another set of interviews, multiple elected officials in small towns described the lengths they went to avoid “‘being in public’ in their community including going to grocery and drug stores in different cities and even states, avoiding social gatherings, and alerting family and friends to their movements about town.”¹⁹⁷
In addition, family members can also experience psychological harm from threats and fear of PV, and individuals or families can further suffer significant monetary costs. These can include the cost of heightened security measures, loss of income (in the case of job resignation), and in certain cases temporary or prolonged relocation from one’s own home. ¹⁹⁸ For example, the Detroit Free Press reported that Michigan Governor Gretchen Whitmer’s husband “retired from his dental practice about eight years earlier than planned, significantly impairing his retirement plans, because of threats arising from her job during the COVID-19 pandemic.”¹⁹⁹ In another case, Richard Barron, a former election director in Fulton County, GA, resigned after receiving hundreds of threats after the 2020 election. Barron commented that “My daughter became worried about me,” and “My condo has floor-to-ceiling windows and she didn’t want me near the windows where they are overlooking the street.”²⁰⁰
Driving Qualified People Out of Public Service
Given the psychological distress and family hardship that can result from threats and fear of PV, it is not surprising that it drives some people out of public service. For example, in the aftermath of threats and intimidation from the 2020 election, local elections officials resigned at an alarming rate. A 2023 survey of local election officials across the country estimated that approximately 1 in 5 election officials nationwide will be serving in their first presidential election in 2024.²⁰¹
The survey also found that:
Nearly three in four feel that threats against election officials have increased in recent years.
Over half say they are concerned that threats, harassment, and intimidation will harm retention and recruitment; likewise, nearly half are concerned about the safety of their colleagues and/or staff.
30% say they have personally been abused, harassed, or threatened because of their job as a local election official.²⁰²
About 18% of election officials also reported that they know of “one or two” officials who left their jobs “at least in part because of fear for their safety, increased threats, or intimidation,” and 4% said they “know many” officials who left their jobs for these reasons.
Another 2023 study of 11 Western states representing 76 million Americans found that “more than 160 chief local election officials have left their positions since November 2020. This represents roughly 40% of the total chief local election officials in the region….”²⁰³ Collectively, these departing election officials held more than 1,800 years of professional experience. One example is Leslie Hoffman, the top election official in Yavapai County, AZ, who announced she was leaving her post in 2022. She commented: “I’m a Republican recorder living in a Republican county where the candidate that they wanted to win won by 2-to-1 in this county and still getting grief, and so is my staff.”²⁰⁴
She attributed her decision to resign, as well as the resignation of another election director, largely to “the nastiness that we have dealt with.”
“I’m a Republican recorder living in a Republican county where the candidate that they wanted to win won by 2-to-1 in this county and still getting grief, and so is my staff.”
In addition to the loss of experience and institutional knowledge, this turnover of election workers requires public resources—recruiting, hiring, and training all cost money. Departing election workers are also concerned about the views and competencies of new workers who will replace them. A 2023 survey of local election officials found that 43% of respondents were either “somewhat” or “very” concerned that “in future elections, some incoming local election officials might believe that there was widespread voter fraud during recent elections.”²⁰⁵
Mayors and state legislators have also been particularly targeted by threats of political violence, and here too, we find strong evidence that this is driving qualified leaders out of public office. For example, a 2021 survey of nearly 1,000 mayors nationwide found that 32.2% of respondents had considered leaving office due to threats, harassment, and political violence. White non-Hispanic women mayors were the most likely (44.3%) to consider leaving due to these factors, followed by women of color (31%), white non-Hispanic men (30.2%), and men of color (20%).²⁰⁶
Consistent with this, a more recent October 2023 survey of state legislators and local officeholders found that:
More than 40 percent of local officeholders said they were less willing to run for reelection or higher office at the time they were surveyed because of abuse. For women, the rates of possible attrition are higher, with approximately half saying they were less willing to continue serving.²⁰⁷
As one example, former Vermont State House Representative Kiah Morris “reported at least 26 incidents to the local police where she and her family felt threatened between 2016 and 2018,” and this caused her to relocate from her home to a new city.²⁰⁸ The severity of abuse, which took place both on and offline, ultimately led Rep. Morris to prematurely resign in 2018.
Narrowing the Candidate Pool
Just as the threat of PV drives people out of the political process, it also drives qualified individuals away from seeking public service in the first place. For example, a 2021 survey of nearly 1,000 mayors around the US found that, “More than two-thirds (69.8%) of mayors knew someone who chose not to run for office” due to possible abuse and threats.²⁰⁸
“A 2021 survey of nearly 1,000 mayors around the US found that, “More than two-thirds (69.8%) of mayors knew someone who chose not to run for office” due to possible abuse and threats.”
This dynamic has the potential to exacerbate existing gender and racial disparities in the composition of political candidates and elected officials in the US. Historically men have been more likely to consider running for public office than women, and white people have been more likely to run for office than people of color. One effect of political violence may be to widen this representation gap, and thus narrow the candidate pool in the US to a more male, and possibly more white, demographic.
To offer a baseline, according to a 2014 study, 2% of Americans have chosen to run for public office (local, state, or federal) at some point in their lives. While men and women each comprise approximately half of the US population, among those who have chosen to run for public office, 75% were men, while only 25% were women.²¹⁰
Consistent with this, a 2021 survey of 4,000 “potential candidates” (people identified as having professional backgrounds such as lawyers, businesspeople, educators, and political activists that are common among elected officials) found that 60% of men had considered running for office, while only 40% of women had.²¹¹
Combined with evidence also showing that women elected officials are more likely to be targeted with threats and abuse, and that they are more likely than men to consider not running for re-election as a result, it is quite likely that the persistence of threats and PV will lead to fewer women choosing to run for public office in the first place.²¹²
“Early on, when we were getting the list of credible threats coming in for members of Congress, they were centered around members of color and there are only 25 black women that serve in the United States Congress… there’s not that many of us… which I think is part of the whole thing of people trying to scare [black women] into silence.”
Threats and fear of PV may also drive fewer people of color to choose to run for office—exacerbating a historic racial gap among political candidates. According to the 2014 study cited previously, white people comprised 66% of the US population but comprised 82% of people who ran for public office. Hispanic and Black people comprised 15% and 12% of the US population respectively, yet only comprised 6% and 5% of political candidates.²¹³
Research finds that non-white elected officials are more likely to receive threats than their white counterparts.²¹⁴ It is entirely possible that this kind of targeting may have a deterrent effect on non-white potential candidates choosing to run for public office, and thus create a more white candidate pool across the US. To give a sense of this kind of targeting, US Representative Nikema Williams stated of her experience in Congress:
Early on, when we were getting the list of credible threats coming in for members of Congress, they were centered around members of color and there are only 25 black women that serve in the United States…there’s not that many of us…which I think is part of the whole thing of people trying to scare people [black women] into silence.²¹⁵
In spite of these threats disproportionately targeting people of color who hold public office, evidence also suggests that thus far people of color who are already in office may be more willing than their white counterparts to run for re-election in spite of threats and abuse.²¹⁶
Creating Barriers to Engagement Between Public Officials and Constituents
In the face of threats and fear of political violence, some public officials have become more hesitant to engage openly with the public. For example, a 2023 survey of more than 1,700 local officeholders across all 50 states found that:
Approximately half of officeholders reported reluctance to communicate via social media because of abuse.
Twenty-three percent of state legislators said they were less likely to hold events in public spaces because of abuse.²¹⁷
Another survey conducted from December 2023-January 2024 of over 400 local elected officials found that even just exposure to insults while working as an elected official decreased a person’s willingness to “attend events in public spaces, go out in public when not working, and post on social media.”²¹⁸ If insults alone have this effect, it is a reasonable deduction that threats of PV amplify it further.
9. What is being done to counter political violence thus far?
Institutions within the federal, state, and local governments, as well as advocacy organizations, have all taken actions to try to counter political violence. However, not all of these efforts are equally distributed geographically, and they vary in terms of who or how they aim to support and protect.
For example, significant attention has been devoted to addressing threats of political violence against elections, election workers, elected officials, and voters at official polling sites. However, relatively fewer new resources have been devoted to addressing threats against the vast number of politically active people who are not government workers or are not at a government building or polling site at the time of an incident.
It is understandable that government and various organizations would emphasize the importance of protecting vital democratic institutions, public servants, and processes such as elections. Nonetheless, even within these efforts, there are significant gaps and limits, as well as large areas of countering political violence against civilians that remain inadequately addressed.
Below are examples of existing approaches to countering PV. They are organized into several categories, including:
Tracking and analysis.
Advocacy and education.
Preventing or reducing political violence.
Supporting targeted individuals.
Increasing detection of and accountability for perpetrators.
The descriptions below are illustrative and not a comprehensive list of the continually developing landscape of efforts. In addition, the focus below is on activities and initiatives. Some of the various laws that address political violence are noted in Part IV of this guide.
1. Tracking and Analyzing the Problem
Several entities track threats, risks, political violence, and/or their impacts. These include the Bridging Divides Initiative, the Armed Conflict Location & Event Data Project (ACLED), the Brennan Center for Justice, the Chicago Project on Security and Threats (CPOST) at the University of Chicago, Democracy Fund, researchers at the National Counterterrorism Innovation, Technology, and Education (NCITE) at the University of Nebraska, Protect Democracy, and the Trust Network.
News organizations have also done significant analysis on this topic, including CNN and Reuters.
2. Advocacy and Education to Address the Problem
A number of organizations make public educational resources and/or recommendations to directly or indirectly address political violence. These include the Brennan Center for Justice, the Committee for Safe and Secure Elections, the Elections Group, Protect Democracy, Horizons Project, Institute for Constitutional Advocacy and Protection at Georgetown University, Issue One, Over Zero, and Search for Common Ground.
3. Preventing or Reducing Political Violence
Efforts to prevent or reduce political violence include work in the following areas:
Bridging polarization, developing inclusive narratives, and fostering dialogue
A wide range of groups aim to reduce societal polarization and promote dialogue among populations with differing views. Organizations such as Braver Angels, Democracy Cafe, Living Room Conversations, the National Conversation Project, and the National Institute for Civil Discourse all foster dialogue across lines of political difference.²¹⁹ The Listen First Project organized the #ListenFirst Coalition comprised of “500+ organizations bringing Americans together across divides to listen and understand each other, to find common ground, and to make bridge-building and collaboration norms.”²²⁰
Some groups also focus specifically on dialogue to prevent political violence, such as Urban Rural Action’s “Prevent Targeted Violence” program in Arizona, Pennsylvania, and Wisconsin.
There is also online and downloadable information on navigating challenging political differences, including resources on communication, narratives, and peacebuilding by the organizations Over Zero and Search for Common Ground.
Groups have also called for pledges of civility from elected officials. For example, the Connecticut Conference of Municipalities advanced a “civility pledge” that calls for “respecting others and their viewpoints and finding solutions for betterment of community.”²²¹ It was signed by over 90 leaders from approximately 60 municipalities.²²² In addition, the National Governors Association started their Disagree Better Initiative to “reduce partisan animosity and foster healthy debate by modeling a more positive and optimistic way of working through policy problems.”²²³
Security resources and training for civilians, public servants, and institutions
There are a growing number of resources and trainings available to help individuals increase their online and physical security and reduce the risk of political violence.
For example, the Bridging Divides Initiative provides an extensive list of training options and resources on de-escalation techniques.
The United States Election Assistance Commission provides a list of resources on security for election officials, covering physical safety, how to document and report threats, how to boost online privacy, how to reach out for help, and other topics.
The US Department of Homeland Security also offers numerous resources on security for individuals and infrastructure.
Many election offices are also taking active measures to increase security. According to a survey of 928 local election officials from February-March 2024, 44% have “updated polling place contingency plan[s],” 41% have “contacted law enforcement to share information and/or create emergency response plans,” 41% “participated in or led security trainings,” and 40% have “enhanced the physical security of election offices or polling places” since 2020.²²⁴
Some states such as Arizona, California, Colorado, and Washington also have programs for election officials and public servants to protect their privacy—for example, by preventing disclosure of their home addresses in response to public records requests.²²⁵ The Arizona bill was introduced by a Republican, received bipartisan support, and was signed by a Democratic governor.²²⁶
The Office of the Arizona Secretary of State has also coordinated mass-shooter drills for election workers and distributed medical resources, barricades, and hammers to break windows in the event of an armed attacker.²²⁷ Election workers’ home addresses were registered with law enforcement to try to prevent danger from swatting.
Michigan instituted de-escalation training for election workers and is adopting a texting program similar to Georgia’s where workers can contact their bosses and law enforcement if they feel in danger.²²⁸
Countering disinformation and misinformation
Calls have been made for social media companies to more aggressively moderate disinformation, with varying degrees of success.
Election officials have also sought to counter misinformation by calling on elected representatives to vouch for the integrity of elections. For example, the executive board of the Colorado County Clerks Association sent a letter to elected officials asking them to express their confidence in elections and “come forward and help us correct the record and regain trust taken from our elections by bullies and bad actors” that engage in “a concerted national and statewide effort to deceive, not through any problems with our actual voting systems.”²²⁹ The letter also included talking points for elected officials to use if they were asked about election integrity issues.
Arizona has also been particularly active in trying to counter misinformation. The secretary of state launched an effort to help members of the public and government staff to discern fake photos and videos produced by artificial intelligence.²³⁰ Officials within Arizona’s Maricopa County have also given “more than 200 tours of their ballot-counting facility, taking people step-by-step through the vote-counting process,” and increased the number of workers (from 2 employees to 7, with a plan to hire more) assigned to respond to election-related inquiries from the public.²³¹ They further tested an emergency communications center in 2022 to communicate with the public about the election process and debunk misinformation in English and Spanish.²³² Officials in Pinal County, AZ, are streaming live footage of ballot drop boxes and using GPS devices to track the movement of ballots and voting equipment as a way to preempt potential misinformation about voting and ballot counting.²³³
Public denunciations by political leaders
Political leaders at times have spoken out to condemn political violence, which can have a significant impact. Unfortunately, some of these same leaders also engage in or tolerate toxic and dehumanizing rhetoric that can incite political violence, which foments and enables the same problem that they are simultaneously condemning.
4. Supporting Targeted Individuals
Transportation support
In 2020, some election offices “provided cab fare, rented vehicles and even obtained temporary license plates so election personnel could not be tracked by their vehicles or identified by their plates.”²³⁴
Legal, reputation, and privacy support
In response to extensive harassment and intimidation of workers, in 2022 Washoe County, NV, approved “payment for legal and personal services by outside third-party organizations in situations where employees are unfairly publicly attacked, harassed, or disparaged by members of the public or by political organizations.”²³⁵
Resources for support and self-care
The Carter Center released a mental health and physical and online security resource for election officials.²³⁶
5. Increasing Detection of and Accountability for Perpetrators
Defamation lawsuits
After the 2020 and 2022 elections, defamation lawsuits were filed against a number of individuals and entities whose claims may have also helped to incite threats of PV.²³⁷ Groups like Protect Democracy also provide litigation support in various cases.
Calling for advertising boycotts of individuals that seem to tolerate, enable, or incite hate or threats
Nongovernmental groups sometimes call for advertising boycotts of individuals and platforms that are alleged or perceived to be tolerating or enabling extremist rhetoric.
Pressure has also been placed on Trustworthy Accountability Group, which describes itself as the “leading global initiative fighting criminal activity and increasing trust and transparency in digital advertising” to remove X’s (formerly known at Twitter) “Brand Safety Certified” seal.²³⁸
Law enforcement responses, including passing new laws imposing penalties on threats and PV, and training police to address threats of PV
Various federal and state laws protect voters and election workers from intimidation. As an example, the Brennan Center for Justice compiled summaries of federal laws and laws in the following states: Arizona, Florida, Georgia, Michigan, Nevada, New Hampshire, North Carolina, Pennsylvania, Texas, and Wisconsin.²³⁹
New laws have also been passed in some states. In 2023, after a slew of resignations of top election officials in the previous three years, Nevada passed SB 406, which makes it illegal “to use or threaten or attempt to use any force, intimidation, coercion, violence, restraint or undue influence with the intent to interfere with the performance of duties of an elections official or retaliate against an elections official for the performance of such duties.”²⁴⁰ The bill also makes it “unlawful to disseminate certain information about an elections official,” such as doxing. Penalties include up to four years in prison.
The Arizona Democratic secretary of state pushed SB 406, and it passed both state legislative chambers unanimously.²⁴¹ The Republican governor signed it at a public ceremony, alongside the secretary of state.²⁴²
Legislative efforts to protect election officials have also happened in other states, including Maine, Minnesota, Vermont, Washington, New Mexico, and Oklahoma.²⁴³
However, new legislation to protect election workers is still absent in many places. A 2024 survey of 928 local election workers around the country found that only 15% reported new legislation since 2020 that aims to protect them, and only 13% reported new funding to increase safety from the federal, state, or local government. Yet, when such legislation passed, 73% of election workers reported that it increased their sense of safety for them and their staff, and when new funding was provided, 83% reported such increases.²⁴⁴
“Federal law prohibits anyone, whether state official or private citizen, from intimidating or threatening any citizen for voting, or attempting to do so. Whether the person intended their actions to intimidate is irrelevant if they have the effect of intimidating voters.”
10. What role can communities play in countering threats and political violence?
Countering political violence effectively requires efforts from multiple groups. Government institutions and organizations are responding, but their efforts cannot substitute for the critical role of organized communities around the country becoming more involved.
This is in part because government efforts face several challenges and limits. First, there are limits in political will—not all states, counties, or cities will necessarily pass strong legislation to counter threats and PV. Government also has limited resources, and thus tends to focus its efforts at points that it feels more able to address (e.g., increasing protection for elections and elected officials at government buildings and polling sites). Based on the constitutional right to freedom of speech, governments also have major limits on what kinds of harassment, threats, and intimidation they can prosecute. Lastly, governments have limits in the kinds of responses (their primary options are prosecutions and fines) that they can apply to perpetrators.
Community engagement is thus necessary to address this problem. With the vast majority of the US population rejecting political violence—and only a tiny minority showing sustained support for it—community members that reject political violence have enormous power. They also have much more flexibility in using their power than governments–for example, they can provide a range of support to candidates who are facing threats. However, in order to use their power effectively, communities need to be organized and to develop strategies to exert influence. That is what this guide is dedicated to.
This conclusion about the essential role of community mobilization aligns with statements of individuals facing heightened risk of threats. One of the few research studies that asked threatened elected officials about the importance of community efforts to counter PV found that:
In one-on-one conversations, elected officials reported—with a high degree of satisfaction—interventions from their community to support them. Local officials described instances of communities holding supportive rallies, working together to combat harassers in public space, and putting out messages of support on social media as reinforcing their confidence in their service to their community and a sense of belonging. These instances stand in sharp contrast to local officials who described friends and community members who shied away from public or private displays of support.²⁴⁵
It can feel uneasy to step forward and get involved in countering political violence. However, unless there are more active efforts to push back, the problem is likely to get worse. There are many options for community members to get involved—including low- and high-visibility roles—as well as both direct and indirect actions that people can take.
Over the last century, when faced with injustice, groups in the US and elsewhere have stepped up nonviolently to fight for rights and democracy. They made violence backfire. We have the benefit of learning from their experiences and applying some of those lessons to countering political violence in the US today.
Footnotes
¹¹⁰ Dresden and Raderstorf, “Threats of Political Violence.”
¹¹¹ For example, another definition is that political violence is “violence aimed at political ends—meant to control or change who benefits from, and participates fully in, U.S. political, economic, and socio-cultural life." See: Nichole Argo Ben Itzhak, Rachel Brown, Heather Hurlburt, Laura Livingston, and Samantha Owens, Building US Resilience to Political Violence: A Globally Informed Framework for Analysis and Action (Washington: Over Zero and New America, 2019).
¹¹² Joe Goldman, Lee Drutman, and Oscar Pocasangre, Democracy Hypocrisy: Examining America’s Fragile Democratic Convictions (Washington: Democracy Fund, 2024).
¹¹³ Data source: Goldman, Drutman, and Pocasangre, Democracy Hypocrisy.
¹¹⁴ These statistics are based on the author’s calculations of polling data presented in Goldman, Drutman, and Pocasangre, Democracy Hypocrisy.
¹¹⁵ Ipsos, “Public Poll Findings and Methodology: Reuters/Ipsos – Political Violence.”
¹¹⁶ Data source: Ipsos, “Public Poll Findings.”
¹¹⁷ Ipsos, “Public Poll Findings.”
¹¹⁸ PRRI, “Survey: Three-quarters of Americans See Democracy at Risk in 2024 Election,” Press release, October 24, 2023.
Notably, there are two aspects of the way this survey question was phrased that likely contribute to its relatively high finding of support for political violence. First, the question refers to speculation about the future by using the phrase “may have to resort to violence.” Thus, the poll result is likely higher than the number of people who think political violence is needed right now. Second, the poll question refers to whether “true American patriots may have to resort to violence in order to save our country.” Many Americans identify as patriots, and their answer to this question may be more about affirming this identity than it is about believing political violence is necessary now.
¹¹⁹ Chicago Project on Security and Threats, “Deep Destructive and Disturbing: What We Know About the Today’s American Insurrectionist Movement,” Slides presented to Adlai Stevenson Center on Democracy, August 6, 2021; Robert Pape, Introducing CPOST’s New ‘Political and Violent Dangers to Democracy’ Tracker (Chicago: CPOST, 2023); Robert Pape, Dangers to Democracy: Tracking Deep Distrust of Democratic Institutions, Conspiracy Beliefs, and Support for Political Violence Among Americans (Chicago: CPOST, 2023)
¹²⁰ Ned Parker and Peter Eisler, “Political Violence in Polarized US at Its Worst Since 1970s,” Reuters, August 9, 2023.
¹²¹ Parker and Eisler, “Political Violence in Polarized US.”
¹²² The Reuters special report defined political violence as: “acts committed by members of the public and linked to an election or partisan political dispute, or premeditated physical attacks driven by a clearly identifiable ideology.”
It added the following clarifications: “Incidents initiated by police or other government agents in their official capacity were excluded.
“Hate crimes were included if there was evidence they were committed in service of an expressed political belief or ideology, such as an attack on a Black person by a member of a white supremacist group or an avowed white nationalist. The tally excludes spontaneous hate crimes in which there was no evidence of a premeditated ideological motive.
“Substantial and intentional property damage associated with protest movements was included, except in cases where the damage was incidental in conflicts with counter-demonstrators or police. Relatively minor property damage, such as graffiti, was not included.
“Cases limited to threats and harassment were excluded.”
¹²³ Dresden and Raderstorf, “Threats of Political Violence.”
¹²⁴ Search criteria for political violence in the ACLED dataset included “battles”, “violence against civilians”, “explosions/remote violence”, and “riots”. These criteria are each defined in ACLED’s Armed Conflict Location & Event Data Project Codebook, 2023.
¹²⁵ US Department of Justice, “2021 Hate Crimes Statistics”; US Department of Justice, “Facts and Statistics”; Warren Fiske, “Gun Homicides 22 Times More Frequent in US Than European Union,” Austin American-Statesman, December 5, 2022.
¹²⁶ James Comey, “Donald Trump Isn’t Coming for Us: The Rule of Law Is Coming for Him,” The Washington Post, January 10, 2024.
¹²⁷ For example, in 2020 the FBI concluded that the Iranian government was behind a website called “Enemies of the People” that included images, home addresses, and other personal information about more than a dozen US federal and state officials, as well as employees of the company Dominion Voting Systems. It claimed, “The following individuals have aided and abetted the fraudulent election against Trump” and added crosshairs to their photos. It further included hashtags #remembertheirfaces and #NoQuarterForTraitors. See: Ellen Nakashima, Amy Gardner, and Aaron C. Davis, “FBI Links Iran to ‘Enemies of the People’ Hit List Targeting Top Officials Who’ve Refuted Trump’s Election Fraud Claims,” The Washington Post, December 22, 2020.
¹²⁸ US Department of Homeland Security, “Summary of the Terrorism Threat to the United States,” National Terrorism Advisory System Bulletin, June 7, 2022.
¹²⁹ “Survey: Three-quarters of Americans,” PRRI.
¹³⁰ “Survey: Three-quarters of Americans,” PRRI.
¹³¹ Data source: PRRI.
¹³² Chris Jackson, Annaleise Azevedo Lohr, Jocelyn Duran, “Very Few Americans Believe Political Violence is Acceptable,” Ipsos, August 22, 2022.
¹³³Jackson, Azevedo Lohr, and Duran, “Very Few Americans.”
¹³⁴ Data source: Jackson, Azevedo Lohr, and Duran.
¹³⁵ Goldman, Drutman, and Pocasangre, Democracy Hypocrisy.
¹³⁶ Goldman, Drutman, and Pocasangre.
¹³⁷ The CNN study “defined politically motivated threats as those targeting named elected officials or election employees or threats focusing on hot-button political issues like abortion rights, police brutality or gun control. Threats that stemmed from a perceived personal grievance – for example, an inmate who threatened the prosecutor of his case and also targeted an elected official in his message – were not considered politically motivated.” Rob Kuznia, Majlie de Puy Kamp, Alex Leeds Matthews, Kyung Lah, Anna-Maja Rappard, and Yahya Abou-Ghazala, “A Deluge of Violent Messages: How a Surge in Threats to Public Officials Could Disrupt American Democracy,” CNN, December 7, 2023.
¹³⁸ Kuznia, et al., “Deluge of Violent Messages.”
¹³⁹ US Department of Justice, “Two Iranian Nationals Charged for Cyber-Enabled Disinformation and Threat Campaign Designed to Influence the 2020 US Presidential Election,” Office of Public Affairs Press Release, November 18, 2021.
¹⁴⁰ Parker and Eisler, “Political Violence in Polarized US.”
¹⁴¹ Parker and Eisler.
¹⁴² Mark Pitcavage, Murder & Extremism in the United States in 2022: Including an In-Depth Analysis of Extremist Mass Killings (New York: Anti-Defamation League, 2022).
¹⁴³ Data source: Pitcavage, Murder & Extremism.
¹⁴⁴ “Yahoo! News Survey, May 23, 2022,” YouGov. https://d3nkl3psvxxpe9.cloudfront.net/documents/20220523_yahoo_toplines.pdf.
¹⁴⁵ Office of Intelligence and Analysis, Homeland Thread Assessment 2024 (Washington: Department of Homeland Security, 2023).
¹⁴⁶ Kuznia, et al., “A Deluge of Violent Messages.”
¹⁴⁷ Kuznia, et al.
¹⁴⁸ Kuznia, et al.
¹⁴⁹ Joel Day, Aleena Khan, and Michael Loadenthal, “Elected Officials Are Being Threatened and Attacked: We’re Tracking That,” The Washington Post, November 9, 2022.
¹⁵⁰ “Local Election Officials Survey,” Brennan Center for Justice, May 2024.
¹⁵¹ Day, Khan, and Loadenthal, “Elected Officials Are Being Threatened”; US Department of Justice, “Readout of Election Threats Task Force Briefing with Election Officials and Workers,” Office of Public Affairs Press Release, August 1, 2022.
¹⁵² Ramachandran, et al., Intimidation of State and Local Officeholders.
¹⁵³ “Threats and Harassment in Local Government: Benchmarking Report,” CivicPulse and Bridging Divides Initiative, January 2024.
¹⁵⁴ “Threats and Harassment,” CivicPulse and Bridging Divides Initiative.
¹⁵⁵ “New Data on Threats and Harassment in Local Government: Analysis Shows Consistently High Baseline of Harassment,” Bridging Divides Initiative, September 26, 2023.
¹⁵⁶ United States Capitol Police, “USCP Threat Assessment Cases for 2022,” Press Release, January 17, 2023.
¹⁵⁷ Day, Khan, and Loadenthal, “Elected Officials Are Being Threatened.”
¹⁵⁸ “Threats and Harassment,” CivicPulse and Bridging Divides Initiative.
¹⁵⁹ CivicPulse and Bridging Divides Initiative.
¹⁶⁰ Rebekah Herrick, Sue Thomas, Heidi Gerbracht, Ceri Jenkins, and Emily Miota, “Intersectional Psychological Violence, Threats, and Physical Violence Against Mayors in 2021,” Women Mayors Network, May 11, 2022; “New Data on Threats,” Bridging Divides Initiative; Dhanaraj Thakur and DeVan Hankerson Madrigal, An Unrepresentative Democracy: How Disinformation and Online Abuse Hinder Women of Color Political Candidates in the United States (Washington: Center for Democracy and Technology, 2022).
¹⁶¹ “Year in Review: Anti-LGBTQ+ Hate & Extremism Incidents, 2022 – 2023,” Anti-Defamation League, June 22, 2023; Tim Squirrell and Jacob Davey, Understanding Threats and Harassment Targeting Drag Shows and the LGBTQ+ Community (London: Institute for Strategic Dialogue, 2023).
¹⁶² Kuznia, et al., “Deluge of Violent Messages.”
¹⁶³ Kuznia, et al.
¹⁶⁴ Day, Khan, and Loadenthal, “Elected Officials Are Being Threatened.”
¹⁶⁵ “Local Election Officials Survey,” Brennan Center for Justice, May 2024.
¹⁶⁶ Parker and Eisler, “Political Violence in Polarized US.”
¹⁶⁷ United States Capitol Police. “USCP Threat Assessment Cases for 2022”; United States Capitol Police. “USCP Threat Assessment Cases for 2023,” Press release, January 18, 2024.
¹⁶⁸ Data source: United States Capitol Police, “USCP Threat Assessment Cases for 2022” and “USCP Threat Assessment Cases for 2023.”
¹⁶⁹ CNN Editorial Research, “Judges Targeted Fast Facts,” CNN, April 24, 2024; US Marshals Service, “Fact Sheet: Judicial Security 2024,” Office of Public Affairs, October 1, 2023.
¹⁷⁰ Data source: CNN Editorial Research, “Judges Targeted Fast Facts”; US Marshals Service, “Fact Sheet: Judicial Security 2024.”
¹⁷¹ Kuznia, et al., “Deluge of Violent Messages.”
¹⁷² The investigation elaborated that “More Republican officials—who were almost never singled out during Obama’s second term—were targeted than Democrats in prosecuted threats during the Trump years (43 Republicans targeted vs. 35 Democrats). However, the number of Democrats who were threatened during Obama’s term—16—more than doubled under Trump.” Kuznia, et al.
¹⁷³ “Local Election Officials Survey,” Brennan Center for Justice, May 2024.
¹⁷⁴ Ramachandran, et al., Intimidation of State and Local Officeholders.
¹⁷⁵ University of Maryland, “Professor Gary LaFree quoted in Reuters Special Report,” Criminology and Criminal Justice Department.
¹⁷⁶ US Government Accountability Office, “The Rising Threat of Domestic Terrorism in the US and Federal Efforts to Combat It,” WatchBlog, March 2, 2023.
¹⁷⁷ Gloria Oladipo, “FBI Report Shows Stark Increase in US Hate Crimes and Drop in Violent Crime,” The Guardian, October 16, 2023; Weihua Li and Jamiles Lartey, “New FBI Data Shows More Hate Crimes: These Groups Saw the Sharpest Rise,” The Marshall Project, March 25, 2023.
¹⁷⁸ Kuznia, et al., “Deluge of Violent Messages.”
¹⁷⁹ For two analyses of the interaction of disinformation and underlying attitudes, see:
Manavir Singh, “Don’t Believe What They’re Telling You About Misinformation,” The New Yorker, April 15, 2024; and Claire Wardle, “Misunderstanding Misinformation,” Issues in Science and Technology 39, no. 3 (Spring 2023); 38–40.
¹⁸⁰ For example, see: Edward Lempinen, “Berkeley Political Scientists Chart a Promising Course to Ease Toxic Polarization,” Berkeley News, May 22, 2023.
A summary of the research findings are that: “In an observational study (N = 1,973), we find that US partisans are willing to subvert democratic norms to the extent that they believe opposing partisans are willing to do the same.
¹⁸¹ US Department of Homeland Security, “Summary of the Terrorism Threat.”
¹⁸² Kuznia, et al., “A Deluge of Violent Messages.”
¹⁸³ Day, Khan, and Loadenthal, “Elected Officials Are Being Threatened.”
¹⁸⁴ Kuznia, et al.; Peter Simi and Seamus Hughes, “Understanding Threats to Public Officials,” DigitalCommons@UNO, August 2023.
¹⁸⁵ Philip Bump, “The Terrorizing Style in American Politics,” Washington Post, September 14, 2023.
¹⁸⁶ The specificity of a threat, the intent of the perpetrator, and the impact of on the victim can all be considered in legal proceedings. For more details, the news organization Reuters published a detailed analysis of various threats and assessed their legality: Peter Eisler, Jason Szep, Linda So, and Sam Hart, “Anatomy of a Death Threat,” Reuters Graphics, December 30, 2021.
¹⁸⁷ Kuznia, et al.
¹⁸⁸ For example, numerous members of Congress have commented off the record that their fear of political violence has influenced key votes. Aaron Blake, “The Role of Violent Threats in Trump’s GOP Reign, According to Republicans,” Washington Post, December 12, 2021.
¹⁸⁹ Bump, “Terrorizing Style.”
¹⁹⁰ Tim Alberta, “Peter Meijer Voted to Impeach. Can He Survive in the GOP?,” The Atlantic, October 31, 2023; Blake, “Role of Violent Threats.”
¹⁹¹ Blake, “Role of Violent Threats.”
¹⁹² Ramachandran, et al., “Intimidation of State.”
¹⁹³ Carter Center, Taking Care of Yourself.
¹⁹⁴ Herrick, et al., “Intersectional Psychological Violence.”
¹⁹⁵ Sarah Ellison, Yvonne Wingett Sanchez, and Patrick Marley, “Violent Political Threats Surge as 2024 Begins, Haunting American Democracy,” Washington Post, January 11, 2024.
¹⁹⁶ Ellison, Wingett Sanchez, and Marley, “Violent Political Threats.”
¹⁹⁷ “The Cost of Local Government Leadership,” CivicPulse and Bridging Divides Initiative, November 30, 2023.
¹⁹⁸ “Election Officials Under Attack,” Brennan Center for Justice.
¹⁹⁹ Paul Egan, “Gretchen Whitmer’s Husband, Marc Mallory, Retired Early from Dentistry Due to Threats,” Detroit Free Press, January 5, 2023; Barbara McQuade, “Swatting and the Dangerous Rise of Political Violence,” New York Times, January 23, 2024.
²⁰⁰ Kuznia, et al.
²⁰¹ “Local Election Officials Survey,” Brennan Center for Justice, April 2023.
²⁰² Threats of political violence are not the only concern of these officials. Under-resourcing of elections offices, misinformation and harassment, and pressure and political interference from political leaders were all listed as concerns by local election officials. “Local Election Officials Survey,” Brennan Center for Justice, April 2023.
²⁰³ Adrien Von Voorhis, Amelia Minkin, Amisa Ratliff, Ariana Rojas, Kathryn Thomas, and Michael Beckel, The High Cost of High Turnover (Washington: Issue One, 2023).
²⁰⁴ Christina A. Cassidy, “Facing Harassment and Death Threats, Some Election Workers Weigh Whether to Stay,” PBS NewsHour, July 8, 2022.
²⁰⁵ “Local Election Officials Survey,” Brennan Center for Justice, 2023.
²⁰⁶ Rebekah Herrick, Sue Thomas, Heidi Gerbracht, and Emily Miota, “Gender and Race Differences in Mayors’ Experiences of Violence,” Center for American Women and Politics.
²⁰⁷ Ramachandran, et al., Intimidation of State and Local Officeholders.
²⁰⁸ Thakur and Hankerson Madrigal, An Unrepresentative Democracy; Amna Nawaz, Candice Norwood, and Matt Loffman, “For Black Women in Government, Highlighting Threats and Abuse Can Make It Worse,” PBS NewsHour, June 29, 2021.
²⁰⁹ Herrick, et al., “Gender and Race Differences.”
²¹⁰ Seth Motel, “Who Runs for Office?: A Profile of the 2%,” Pew Research Center, September 3, 2014.
²¹¹ Jennifer L. Lawless and Richard L. Fox, “Running for Office is Still for Men: Some Data on the ‘Ambition Gap,’” Brookings Institution, February 8, 2022.
²¹² Herrick, et al., “Gender and Race Differences.”
²¹³ Motel, “Who Runs for Office?”
²¹⁴ “Local Officials Continue to Face High, Widespread Hostility: Latest Findings from Ongoing Threats and Harassment Survey,” Bridging Divides Initiative, February 8, 2024.
²¹⁵ Thakur and Hankerson Madrigal, An Unrepresentative Democracy.
²¹⁶ Herrick, et al., “Gender and Race Differences.”
²¹⁷ Ramachandran, et al., Intimidation of State and Local Officeholders.
²¹⁸ “Local Officials Continue to Face,” Bridging Divides Initiative.
²¹⁹ Sarah McCammon, “Can We Come Together? How Americans Are Trying to Talk Across The Divide,” NPR, April 5, 2019.
²²⁰ Listen First Project.
²²¹ Kevin Maloney, “92 Municipal Leaders from Nearly 60 Towns Take CCM’s ‘Civility Pledge’ to Help Lead Local Efforts Toward More Respectful Civil Engagement in CT Communities,” CCM.
²²² Braley Dodson, “Connecticut Leaders Take ‘Civility Pledge,’” WTNH, December 12, 2022.
²²³ “Disagree Better,” National Governors Association.
²²⁴ “Local Election Officials Survey,” Brennan Center for Justice, May 2024.
²²⁵ Joe Allen, “One Quiet Bipartisan Way State Legislatures Are Making Election Administration Stronger,” Protect Democracy, July 7, 2023; “Providing Safety and Security,” Committee for Safe and Secure Elections.
²²⁶ “Arizona Senate Bill 1061,” LegiScan, 2023.
²²⁷ Yvonne Wingett Sanchez, “Election Officials Go on Offense to Prevent Disruptions of 2024 Vote,” Washington Post, February 9, 2024.
²²⁸ Wingett Sanchez, “Election Officials.”
²²⁹ Colorado County Clerks Association, “A Call to Action for Elected Officials,” Public Letter, December 8, 2023; Wingett Sanchez, “Election Officials.”
²³⁰ John Sakellariadis, “Arizona Creates Own Deep-fake Election Hoaxes to Prepare for 2024,” Politico, December 22, 2023.
²³¹ Wingett Sanchez, “Election Officials.”
²³² Wingett Sanchez, “Election Officials.”
²³³ Wingett Sanchez, “Election Officials.”
²³⁴ Running Elections Without Fear, The Elections Group.
²³⁵ Mark Robison, “Election Threats and Stress: Washoe County Registrar of Voters Deanna Spikula Looks Back,” Reno Gazette Journal, July 31, 2022; Mark Robison, “Washoe County Fights ‘Character-Assassinating Accusations’ Against Election Staff,” Reno Gazette Journal, July 18, 2022.
²³⁶ Carter Center, Taking Care of Yourself.
²³⁷ Hagen, Lisa. “There Are Even More 2020 Election Defamation Suits beyond the Fox-Dominion Case.” NPR, April 19, 2023; Jonathan J. Cooper, “Arizona Republican Election Official Sues Kari Lake for Defamation,” AP News, June 23, 2023.
²³⁸ Nandini and Claire, “Confirmed: Elon Musk’s X Lost a Huge Brand Safety Certification After Our Complaint,” Check My Ads, March 20, 2024; Trustworthy Accountability Group; “Promote Brand Safety,” Trustworthy Accountability Group.
²³⁹ “Laws Protecting Voters,” Brennan Center for Justice.
²⁴⁰ Gabe Stern, “As Election Nears, Nevada County Clerks Grapple with Burnout,” AP News, October 25, 2022; “SB406 Overview,” NELIS, 2023.
²⁴¹ “SB406 Text,” NELIS, 2023; Gabe Stern, “Nevada Becomes Latest to Enhance Penalties for Election Worker Intimidation after Statewide Exodus,” AP News, May 31, 2023.
²⁴² Stern, “Nevada Becomes Latest.”
²⁴³ Stern, “Nevada Becomes Latest”; “Bill to Make Interfering with Election Workers a Crime OK’d,” AP News, February 7, 2022; Office of the Minnesota Secretary of State Steve Simon, “New Legislation to Protect Election Workers Takes Effect June 15,” Press Release, June 15, 2023; Lisa Rathke and Christina A. Cassidy, “States Seek to Protect Election Workers amid Growing Threats,” AP News, February 3, 2022; “Bill Hardening Penalties for Election Worker Harassment OK’d,” AP News, January 13, 2022; Morgan Lee, “New Mexico Senate Seeks New Protections for Election Workers,” AP News, February 8, 2022; Oklahoma State Election Board, “New Law Provides Security for Oklahoma Election Workers,” Press Release, May 4, 2023.
²⁴⁴ “Local Election Officials Survey,” Brennan Center for Justice, May 2024.
²⁴⁵ “Cost of Local Government Leadership,” CivicPulse and Bridging Divides Initiative.